DIRECTOR: Prof. S. Vijaya Bhaskara Rao
*Recognized as a National Facility in the Country by the University Grants Commission, New Delhi.
Historical Backdrop:
To create scientific awareness about the potential use of the sophisticated radar and other instrumentation facilities for advanced research in the area of atmospheric sciences and to attract bright and young researchers to utilise the MST Radar, Lidar and other co-located Facilities available at NARL, Gadanki; University Grants Commission (UGC) has established an UGC-SVU Centre at S.V. University, Tirupati, to serves as a common platform for the University system in India for the exchange of scientific knowledge and the centre is accessible to scientist and researcher from Indian Universities working in the area of Atmospheric Sciences.
Objectives& Salient Features:
In the current academic year, the following members (Faculty, Scientists and Research scholars) have visited UGC-SVU Centre.
Ph.D. degrees Awarded:
Papers published in International Journals during (1st April, 2020 to 31st March , 2021) (in collaboration with NARL):
Salient features of work done:
Inter-annual variability of atmospheric gravity waves in the Martian thermosphere: effects of the 2018 planet encircling dust event
The present study deals inter-annual variability of atmospheric gravity waves (GWs) in the Martian thermosphere and their relation to the background temperatures using Ar densities measured by (Mars Atmosphere and Volatile Evolution Mission/Neutral Gas and Ion Mass Spectrometer) MAVEN/NGIMS. The amplitudes and wavelengths of the GWs are extracted from the neutral density perturbations in the inbound segment of the MAVEN orbit. The GW amplitudes predominantly lie between 5% and 10 % and are mostly less than 30% of the background densities. The horizontal wavelengths are between 50 km and 300 km with peak wavelengths of 100-130 km. GW amplitudes show a significant diurnal variation with larger amplitudes during nighttime and smaller amplitudes during daytime (Figure 1). Most importantly, the GW amplitudes are larger and the wavelengths are smaller when there was a Planet Encircling Dust Event (PEDE) in the Mars’ lower atmosphere during 2018. As a result, the typical diurnal variation of GW amplitudes is not apparent during PEDE-2018.
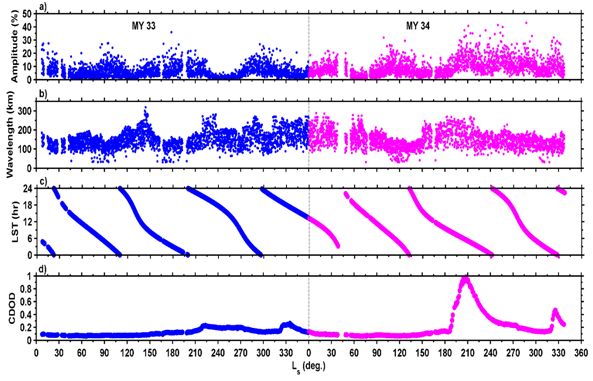
Figure 1: Solar longitude variation of (a) GW amplitudes, (b) GW wavelengths, (c) MAVEN periapsis local time, and (d) CDOD. Gaps in the continuity of plots are due to the non-availability of NGIMS observaitons.
During the lower atmospheric dust event (usually occurs between Ls 180o to 360o in every Martian Year) the GW amplitudes do not show any significant correlation with the background temperatures (Figure 2). It is proposed that the deep convection associated with the lower atmospheric dust events is a significant source of high frequency gravity waves that propagate into the upper thermosphere. The lack of negative correlation between gravity wave amplitudes and the background temperature during PEDE-2018 is interpreted as due to changes in the background atmosphere, gravity wave propagation characteristics and gravity wave saturation processes.Furthermore, the negative correlation between the GW activity and the background temperature that is clearly observed during nondust periods is not sustained during the dust event time. Though this is explained in the presentstudy by considering the selective filtering of the upward propagating GWs by the modified circulation in the middle atmosphere
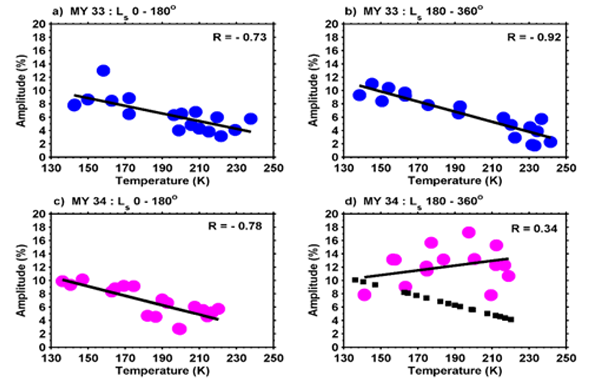
Figure 2: Correlation between GW amplitudes and temperatures for (top panels) MY 33 and (bottom panels) MY 34 for (a) Ls=0°-180° and (b) Ls=180°-360°.
Interaction of a Low-Pressure System, an Offshore Trough, and Mid-Tropospheric Dry Air Intrusion: The Kerala Flood of August 2018
The present study examines the Kerala Flood Event (KFE, 15–16 August 2018, in India) that occurred along the west coast of India and resulted in ~400 mm of rainfall in one day. The KFE was unique in comparison to previous floods in India, not only due to the rainfall duration and amount, but also due to the fact that the dams failed to mitigate the flood, which made it the worst in history. The main goal of this study is to analyze and elucidate the KFE based on meteorological and hydrological parameters. A propagating low-pressure system (LPS) from the Bay of Bengal (BoB) caused the streak of plenty of rainfall over Kerala, the west coast, central India, and the BoB. Additionally, the upper-tropospheric anti-cyclonic system over the Middle East region inhibited a northward advancement of LPS. On the western coast of India, a non-propagating (with diurnal fluctuations) offshore trough was observed over the west coast (from Kerala to Gujarat state). Therefore, a synergic interaction between LPS, an intrusion of dry air in the middle-troposphere, and the offshore trough was the main reason for KFE. However, after around ten days, rainfall saturated the dam capacities; thus, the released water, along with the amount of precipitation on the day of the event, was one of the other possible reasons which worsened the flood over Kerala.
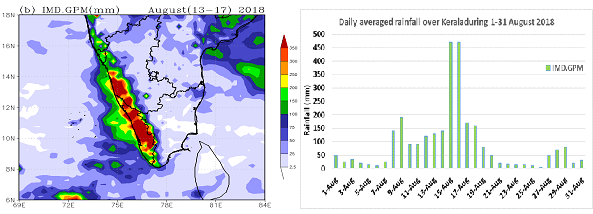
Figure 3 Accumulated rainfall (mm, shaded)Kerala state derived from Indian Meteorological Society (IMD) + Global Precipitation Measurement (GPM) merged products at a 25 km resolution for 13–17 August 2018. (c) Daily area-averaged rainfall (mm) over the Kerala state (8–13° N and 74–78° E) during August 2018.
As usual, most of the heavy rainfall is located in the southern part of the LPS track. A low-pressure system embedded in the mean monsoon flow brings copious rainfall to its southwest sector. Over BoB, LPS lingered for a while; thus, heavy rainfall is evident over that area. Furthermore, it will be interesting to investigate the rainfall over west-coastal regions and Kerala, as LPS advances westward. It has been observed that when LPS over BoB and the offshore trough near the Gujrat region are active, then the Indian landmass receives plenty of rainfall. The authors focus on the spatial spread of rainfall over Kerala and adjoining states through 13–17 August, 2018 (Figure 3). The maximum accumulation of rainfall (>350 mm) was recorded over northern Kerala and southern coastal regions of Karnataka. An adjacent state, Tamilnadu, being under the rain-shadow influence (receives low rainfall due to the subsidence of warm and dry air), received less rainfall.
Sensitivity to Initial Conditions on the Simulation of Extratropical Cyclone ‘Gong’ formed over North Atlantic
The role of initial conditions (ICs) in the simulation of severe winter storm ‘Gong’ formed over North Atlanticis studied. The life cycle of Gong started at 1800 UTC of 16 to 0600 UTC of 22 January 2013, with CSLP of 972 hPa. The gusty wind (~33 ms-1) and torrential rainfall of ~90 mmd-1 recorded over several major cities of the Iberian Peninsula. Five numerical experiments were performed with the WRF model by initializing at 0600 UTC of 16, 1800 UTC of 16, 0600 UTC of 17, 1800 UTC of 17, and 0600 UTC of 18 January 2013. Our results suggest that significant differences are seen among the experiments, particularly with the ICs of 0600 UTC 17 January 2013,which represent the quick movement of Gong with a slight underestimation of intensity. The experiment with IC 0600 UTC 18 January 2013 produced the best simulation as compared to the observations. The simulated track, intensity, wind flow, and rainfall were well agreeing with the observations. The 12-hour average track errors were ranging from 95-332 km with 24-, 36-, 48-, 60-, and 72 hours lead time.
An attempt has been made to understand the dynamical mechanisms which are responsible for the surface cyclogenesis associated with vertical motion are Q-vector field signifies complete and meaningful solution for the direction of vertical motion, either southerly flow with warm advection induces an upward motion, or northerly flow with cold advection induces a downward motion.
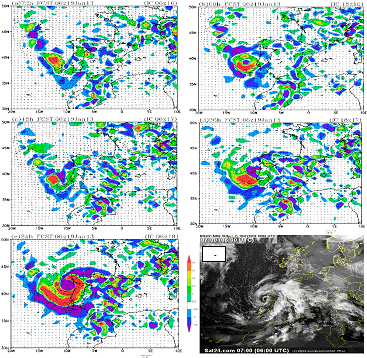
Figure 4. 700–500 hPa column-averaged Q-vector convergence (shaded: x1015 m2 s-1kg-1) and Q vector wind fields (a) 72- (b) 60- (c) 48- (d) 36- (e) 24- lead derived from WRF experiments valid on 0600 UTC 19 January, 2013; Fig (f) Eumetsat/Met office satellite picture valid on 0600 UTC 19 January, 2013 [Sat24.com].
The column-averaged (700–500hPa) Q-vectors and Q-vector convergence demonstrate the potency of the upper-tropospheric wave affecting the lower to middle tropospheric ascent and associated with surface cyclogenesis.The 700–500 hPacolumn-averaged Q-vectors and convergence over the western and eastern sectors (Figure 4) indicating the lower to middle tropospheric ascent associated with surface cyclogenesis. The column average Q-vectors represented a significant development of baroclinicwaves (Figure 1). The regions of convergence and divergence are represented with positive and negative values of Q-vector arise due to combined shear frontogenesis and deformation frontolysis.


 FLYING STARS